
Americans seem to be living longer now, but they still aren’t ahead of other countries when it comes to life expectancy. A latest study by IHME in conjunction with Imperial College London investigators suggests life expectancies in over 80% of U.S. counties to have dropped between 2000 and 2007. This was when the numbers were pitted against the average of the 10 countries that showed the best life expectancies.
Newly released mortality data from the National Center for Health Statistics was employed by the scientists. They then computed life tables by age, sex, and county for the US from 2000 to 2007 separately for each sex, for whites, blacks and all the races in combination. With the U.S. boasting of wide racial/ethnic and geographic disparities, the study intended to not just ascertain the existing health state of the population but also to gain a baseline for the future. Both absolute and relative progress for every county was assessed as part of the study.
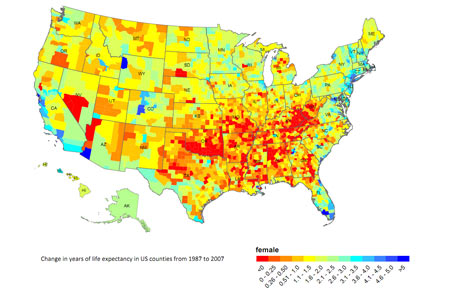
In comparison to countries like Japan and Canada, most counties in the U.S. appeared to be lagging behind. In the former nations, life expectancies are known to considerably grow each year. According to the findings, in 2007, the life expectancy for men and women was in the range of 65.9 to 81.1 years and 73.5 to 86 years respectively. The lowest life expectancies were apparently seen for both sexes in the Appalachia and Deep South counties. In comparison, the northern Plains and regions along the Pacific coast and the Eastern Seaboard showed the highest life expectancy.
“We are finally able to answer the question of how the US fares in comparison to its peers globally,†shared Dr. Christopher Murray, IHME Director and one of the paper’s co-authors. “Despite the fact that the US spends more per capita than any other nation on health, eight out of every 10 counties are not keeping pace in terms of health outcomes. That’s a staggering statistic.â€
When measured against the international frontier, U.S. counties appeared to vary from standing at 16 calendar years ahead to over 50 calendar years behind for women. For men, it ranged from 15 calendar years ahead to more than 50 calendar years behind. All across the nation, women seemingly fared poorly in contrast to men. In about 40 percent of U.S. counties, women reportedly trailed by over five years behind countries that had the best life expectancies. In only about half as many counties men were seen falling that far.
For black women, life expectancy allegedly ranged between 69.6 and 82.6 years while it was between 59.4 and 77.2 years for black men. No counties appeared to race ahead of the international frontier with some even showing a trail-back of more than 50 years. The investigators point out that the low relative performance of the U.S. in comparison to the international frontier may not be only because of racial disparities. This could be mainly because white Americans showed identical life expectancy performance to that exhibited by all of the races when combined.
The investigators are of the opinion that addressing risk factors may narrow county-level life expectancy disparities. This is mainly because the exposure to risk factors could change from county to county. Also a state-level analysis reflected the risk factor exposures to be seemingly higher in regions with greater mortality rates. In order to evaluate this, the authors hope to reach out to an all-inclusive way of measuring mortality inferable to poor standard of care in the U.S. They also look at assessing its impact on disparities. This they believe could help them in the future.
Called ‘Falling behind: life expectancy in US counties from 2000 to 2007 in an international context’, this study appears in Population Health Metrics 2011.